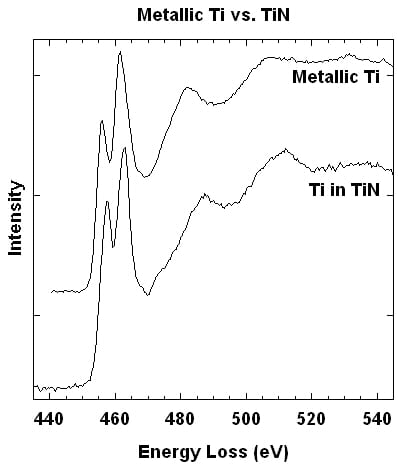
The first two peaks in the spectra are the Ti L3 and L2 edges respectively. Even for the metal, the L3/L2 branching ratio deviates from the 2:1 statistical ratio, and as is typical for early transition metal elements, the L3 edge is less intense than the L2 edge. The actual peak ratio is sensitive to the sample thickness because of plural scattering by plasmons, so it is better to track the relative energy shift of the peaks when looking to infer chemical changes
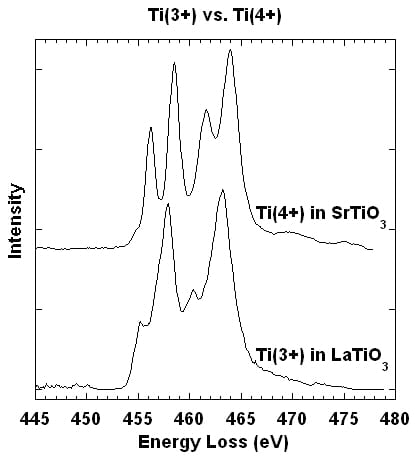
The Ti L3 and L2 edge each split into 2 peaks, reflecting the eg/t2g crystal field splitting around the octahedrally-coordinated Ti cation. The Ti3+ formal valence has the spectrum shifted to a lower energy
By: Lena Fitting Kourkoutis
Microscope: FEI Tecnai T20
Energy Resolution: 1.0eV