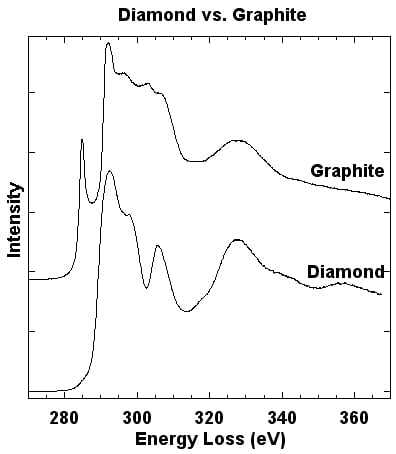
The graphite EELS spectrum starts with a characteristic sharp peak at 284.5 eV from the 1s to pi* transition. The Diamond spectrum lacks this peak, and it’s onset is delayed by about 5 eV
By: David Muller
Note: The first peak in the graphite plot is due to absorption byπ*states. The second peak in the graphite plot, which is the leading edge in the diamond plot, is due to absorption by the σ*states.
Note: The first peak in the graphite plot is due to absorption by π* states. The second peak in the graphite plot, which is the leading edge in the diamond plot, is due to absorption by the σ* states.
Recorded on a VG-501 at 0.7 eV energy resolution